Use IT weather to model your Nutanix Cluster
ServiceNav’s IT Weather feature allows you to graphically model your Nutanix Cluster.
Exploitation of IT Weather requires the prior establishment of monitoring of the various elements constituting the Nutanix Cluster.
IT Weather in a few steps:
Monitoring of the Nutanix Cluster:
Monitor the status and performance of your Nutanix Cluster by configuring service templates to measure:
- Nutanix-Cluster-Status
- Nutanix-Cluster-IOPS
- Nutanix-Cluster-Latency
- Nutanix-Cluster-IOBandwidth
Capacity monitoring and performance of Nutanix Cluster Storage:
Oversee the general use of Nutanix Cluster Storage using service templates to measure:
- Nutanix-Cluster-StorageUsage
A Nutanix Cluster Storage cluster consists of a Container and a grouping of one or more Storage Pools. In the event of an alert from ‘Nutanix-Cluster-StorageUsage’, you can rapidly identify the cause by additionally monitoring the Containers and Storage Pools using the service templates:
- Nutanix-Container-Usage
- Nutanix-Storage Pool-Usage
Monitoring the Nutanix Blocks composing the Cluster:
Ensure the health of your Nutanix Blocks by using the following service templates:
Monitoring the Hypervisors of each Nutanix Node:
Ensure the hypervisors of each Nutanix Node are in good health.
In the case of VMware technology, you can use the following service templates to monitor the health of your ESXs:
- VMware-ESX-CPU
- VMware-ESX-Datastore
- VMware-ESX-DiskIO-Read
- VMware-ESX-DiskIO-Write
- VMware-ESX-Hardware
- VMware-ESX-NetUsage
- VMware-ESX-RAM
- VMware-ESX-Runtime_Issues
- VMware-ESX-Runtime_status
- VMware-ESX-Services
- VMware-ESX-Services-WithExclusion
- VMware-ESX-SWAP
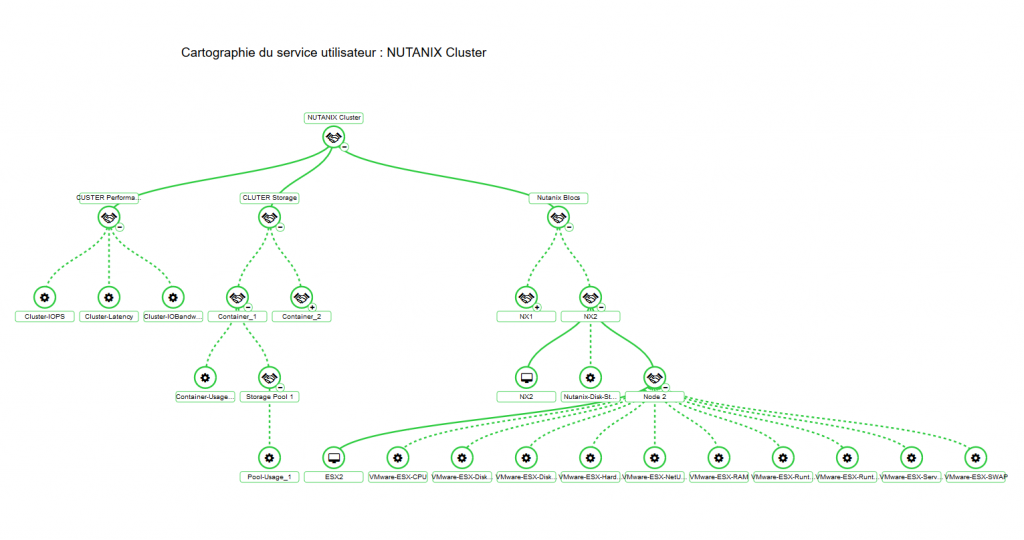
Example of an IT Weather service of a Nutanix Cluster:
Once the monitoring is done, you can model your IT Weather.
In the screenshot below, we find the different elements constituting a Nutanix Cluster including:
- The status and performance of the Cluster,
- The use of Storage,
- The physical state of the different hosts constituting the cluster.
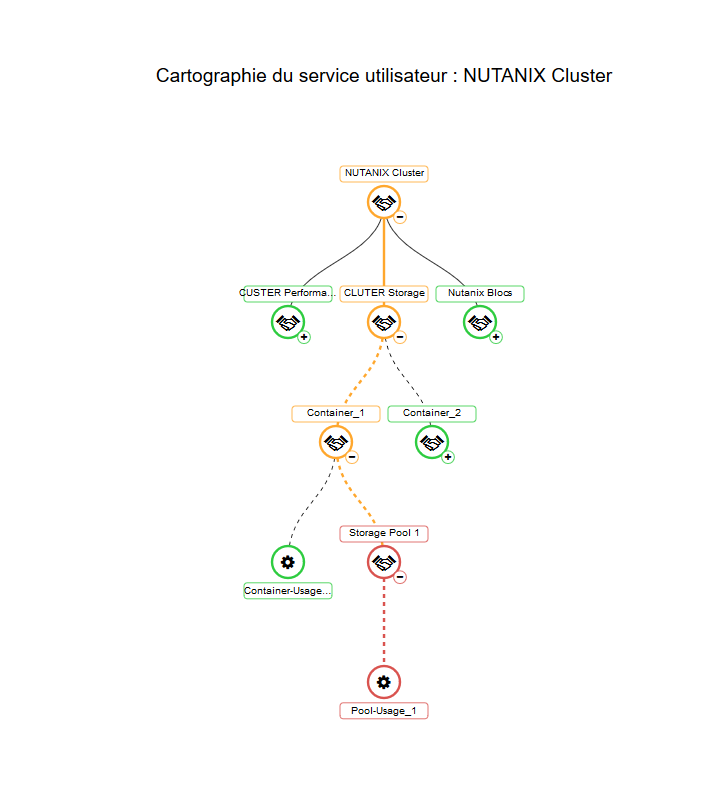
As shown in the screenshot below, such a viewpermits the rapid identification of “root cause” or root causes of a degradation of the Nutanix Cluster. The example screenshot below clearly shows degradation being due to a Critical Alert from Pool Usage 1 of Container 1:
Heading the ServiceNav BU in Coservit, ISV in the IT&IoT monitoring - disruptive use cases with bigdata and AI.