More recent posts from the Servicenav team
27/3/20

ServiceNav 4.9 – New widget, SMS voice notifications, service templates
22/1/20

ServiceNav 4.8 – Graph widget improvements, new icons, service templates
10/1/20

As the role of IT has escalated in commercial importance, the head of IT has risen up the organizational chart to having a seat on the board. The resulting CIO role is a big one – critical to the operations of the organization and a huge financial responsibility for budget management.
A major key to success in this role is aligning IT with the organizations’ priorities; making the right investment decisions, getting commercially critical projects delivered on time, ensuring IT service levels are meeting targets and meeting the needs of the end users across the organization.
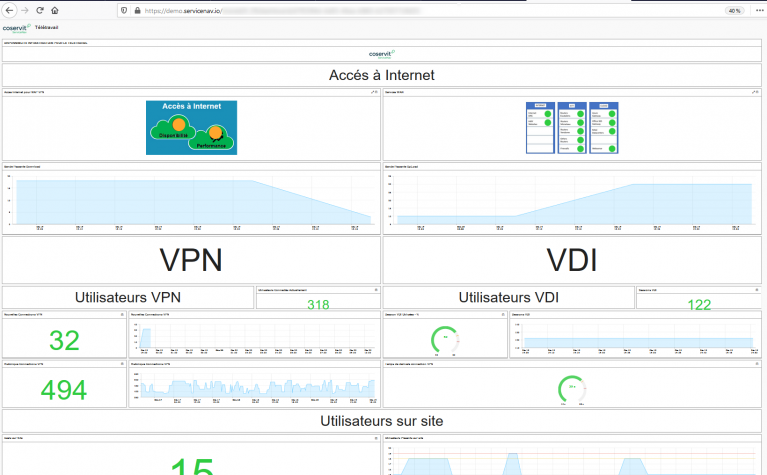
Proving you’re successful requires analysis of lots of data. But this isn’t about recording statistics for statistics sake, it’s about being smart about the tools used and the reports that are produced so that they are meaningful to their intended audience.
In these days of Big Data, it’s not the data that has the power, but the manipulation of that data into context. The same data can be used by a systems engineer to proactively resolve service impacting failures at a device or application level, and also contribute to retrospective analysis of service level delivery.
Historical data also has a powerful role to play in infrastructure spending forecasting and justification as well as ROI analysis. Finance want to know the money spent on new IT infrastructure has resulted in the promised improvements to service delivery. They also want to clearly justify any further spending by understanding the impact of not investing.
See more in the popular CIO blog Top 10 Metrics for a new CIO which presents the most important, measurable aspects of the IT function in order to enable those new to the CIO role to break the elephant sized remit into smaller chunks.
27/3/20

22/1/20

10/1/20
