Our Blog

Looking to learn about all things ITSM, ESM, Self-Service, Knowledge Management, AI, and more? We've got you covered.

Resource Center

We’re committed to providing resources that help you address all of your ITSM software needs.

Webinars & Events

Stay up to date on our latest ITSM, ITOM or ESM webinars and events now

Real-Time Dashboards


DATAVIZ DASHBOARD

pink line

A dashboard that provides insight into your business for all stakeholders. 

EV Observe’s goal is to simplify service level monitoring and to create dashboards easily and efficiently.  Providing fast and reliable access to this information reduces the effort required to create reports and enables your team to focus on the maintenance and growth of services.

Datasheet

Future-Ready Monitoring Technology to Take Your ITSM to the Next Level

Download
Real-time_Dashboards-1

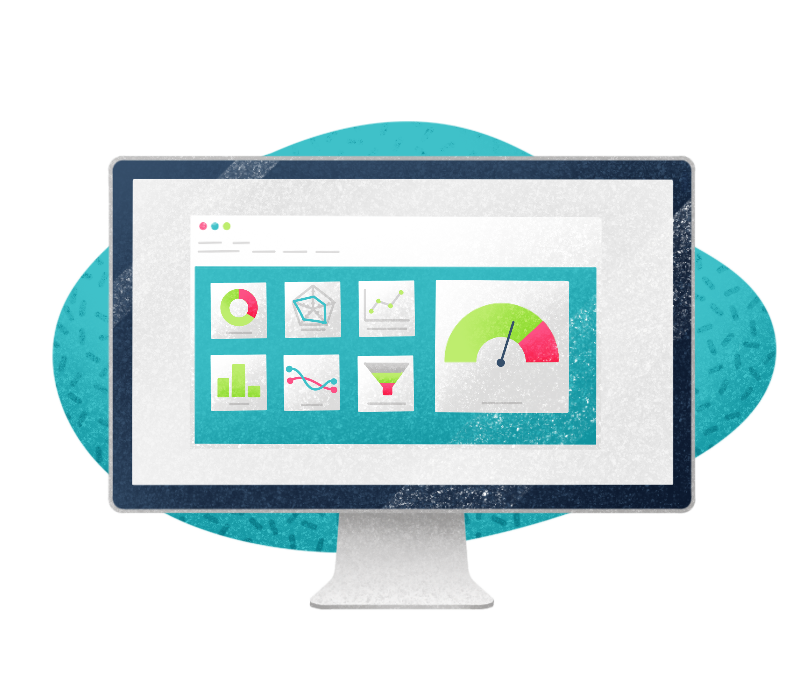
Infrastructure Overview Easily Provided by Widgets

A widget gallery created for information services environments allows you to visualize all IT services.

With Dataviz you can model your infrastructure without any code in just minutes. Multiple formatting options are available to help build your model such as graph, gauge, list, map, network, crosstab, text, image and others.

Dataviz allows you to focus on your customers, your users, and your message. The gallery of widgets is constantly evolving and providing new opportunities to communicate with each product release.


Real-time_Dashboards-2

Reduce Time Required to Produce and Distribute Dashboards

Effective communication begins with a comprehensive dashboard and creating and distributing this dashboard will no longer require extensive effort and time.

Preparation
Use the widget bank and our templates to quickly configure your own monitoring dashboard

Broadcasting
Distribute dashboards to other applications without any code with a single click.


Real-time_Dashboards-3

An Effective Communication tool

Implementing a communication strategy that makes IT easier to understand for users and customers is one of the biggest challenges facing IT departments.

Our intelligent and flexible dashboards and reports can be customized to meet the needs of your internal processes, regardless of the type of organization you are supporting. Reports and dashboards have been designed to be easy to understand, highlighting the information that is most important to the reader, whether it is a customer, a member of the technical team, the CTO or even the CEO. Information can be presented in granular technical detail or in a graphical abstraction using the Service Weather feature.


Simplify IT Service Management

Learn More

Help Users Help Themselves

Learn More

Build People-Centric User Experiences

Learn More